logistics-delivery-analytics-dashboard
Logistics Delivery Analytics Dashboard — Portfolio Demo
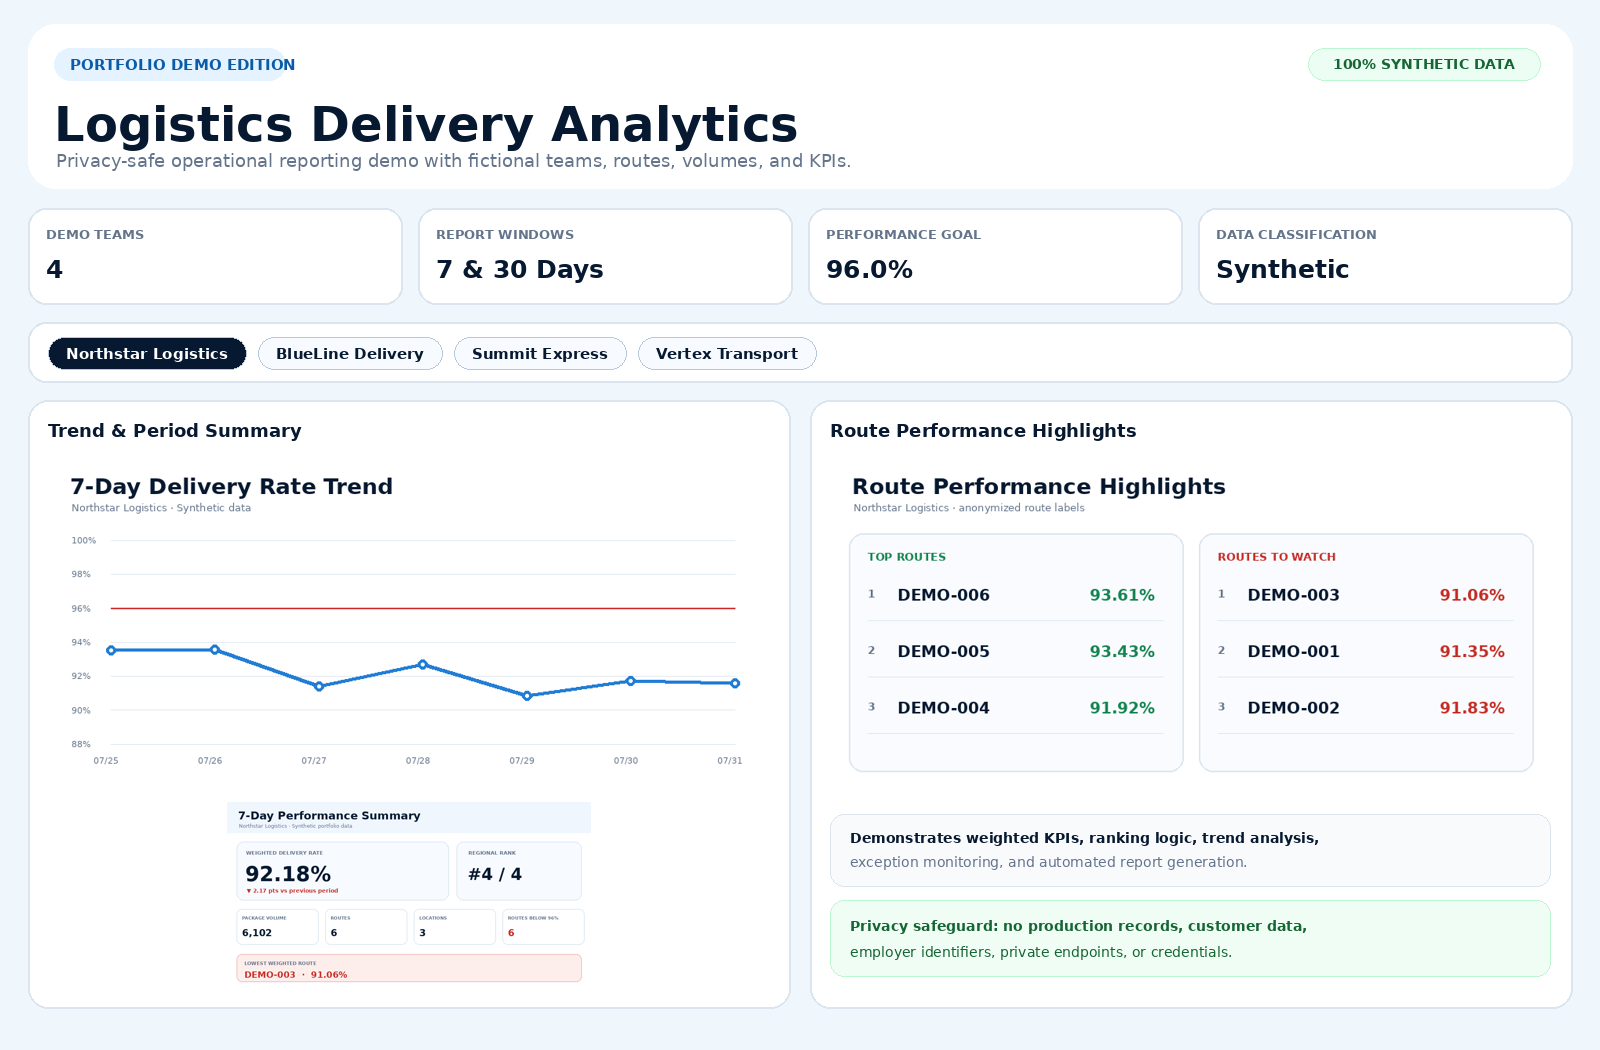
A privacy-safe portfolio edition of a logistics delivery analytics dashboard. It demonstrates how route-level operational records can be transformed into weighted KPIs, team rankings, period comparisons, exception summaries, and management-ready visual reports.
Data safety: This project uses deterministic synthetic data and fictional labels only. It contains no production records, customer information, employer identifiers, private endpoints, API credentials, or proprietary mappings.
What It Demonstrates
- Volume-weighted delivery performance calculations
- Seven-day and thirty-day performance summaries
- Period-over-period change tracking
- Team ranking and route-level exception monitoring
- Synthetic route, warehouse, volume, and delivery-rate generation
- Automated PNG report creation with Pillow
- Responsive Flask dashboard with interactive team tabs
- Privacy-aware portfolio publishing
Technology Stack
- Python
- Flask
- Pillow
- HTML / CSS / JavaScript
- Operations analytics
- KPI reporting and data visualization
Run Locally
python -m venv .venv
source .venv/bin/activate      # Windows: .venv\Scripts\activate
pip install -r requirements.txt
python app.py
Open http://127.0.0.1:5000.
Repository Structure
app.py                 Synthetic data, KPI logic, and report generation
templates/index.html    Responsive portfolio dashboard
static/generated/       Generated synthetic report images
docs/                   Portfolio screenshots
requirements.txt        Python dependencies
Portfolio Value Proposition
This project shows my ability to convert operational data into clear decision-support tools while protecting confidential business information. The public version preserves the core reporting logic and user experience but replaces all sensitive inputs with reproducible fictional data.
Suggested GitHub Topics
python flask data-analytics operations-analytics logistics dashboard pillow kpi portfolio